A simple ggplot of some measure against depth
set up
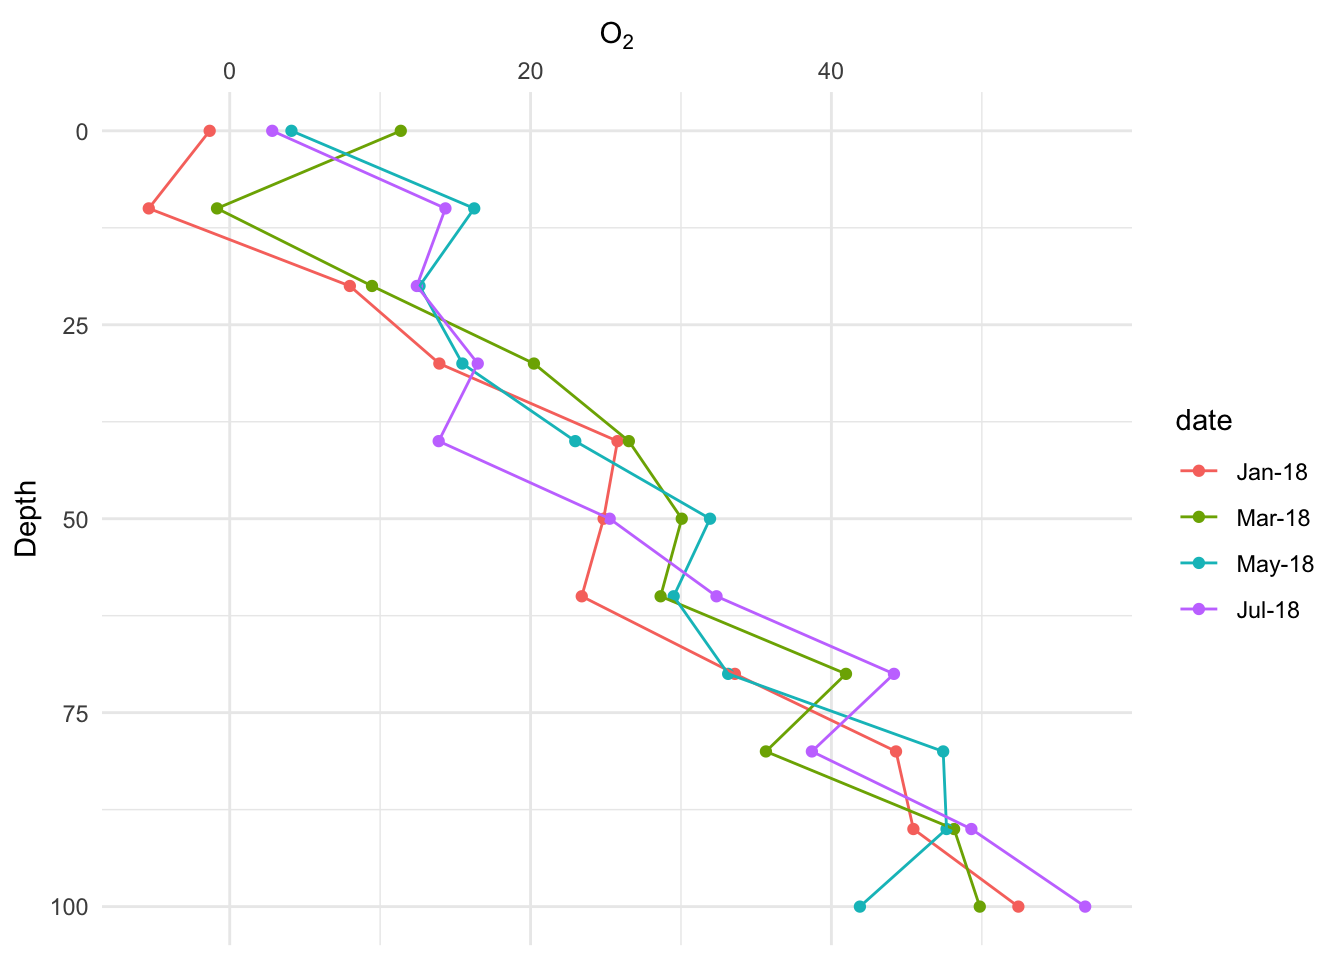
The goal is to plot the measure of something, say O2 levels, against depth (soil or lake), with the measures taken on multiple days
library(ggplot2)
library(data.table)
First – create fake data
depths <- c(0, seq(10,100, by=10))
dates <- c("Jan-18", "Mar-18", "May-18", "Jul-18")
x <- expand.grid(date=dates, depth=depths)
n <- nrow(x)
head(x)
## date depth
## 1 Jan-18 0
## 2 Mar-18 0
## 3 May-18 0
## 4 Jul-18 0
## 5 Jan-18 10
## 6 Mar-18 10X <- model.matrix(formula(~date + depth), data=x)
head(X)## (Intercept) dateMar-18 dateMay-18 dateJul-18 depth
## 1 1 0 0 0 0
## 2 1 1 0 0 0
## 3 1 0 1 0 0
## 4 1 0 0 1 0
## 5 1 0 0 0 10
## 6 1 1 0 0 10beta <- c(0,1,2,3,0.5)
y <- X%*%beta + rnorm(n, sd=5)
fake_data <- data.frame(O2=y, x)
head(fake_data)## O2 date depth
## 1 -1.3329187 Jan-18 0
## 2 11.3715570 Mar-18 0
## 3 4.1045517 May-18 0
## 4 2.8264293 Jul-18 0
## 5 -5.3809814 Jan-18 10
## 6 -0.8433094 Mar-18 10Second – make ggplot
gg <- ggplot(data=fake_data, aes(x=depth, y=O2, group=date, color=date)) +
  geom_point() +
  geom_line() +
  coord_flip() +
  # coord_flip does not make the y-axis the x-axis but the horizontal axis.
  # so still need to refer to "y" to modify O2
  # specify position="right" to flip the y axis to the top after coord_flip
  scale_y_continuous(position = "right") +
  # reverse the depth axis, which makes it go down instead of up
  scale_x_reverse() +
  xlab("Depth") +
  ylab(expression(O[2])) +
  theme_minimal() +
  NULL
gg