
What does cell biology data look like?
If I’m going to evaluate the widespread use of t-tests/ANOVAs on count data in bench biology then I’d like to know what these data look like, specifically the shape (“overdispersion”) parameter.
Set up
library(ggplot2)
library(readxl)
library(ggpubr)
library(cowplot)
library(plyr) #mapvalues
library(data.table)

# glm packages
library(MASS)
library(pscl) #zeroinfl
library(DHARMa)
library(mvabund)

  data_path <- "../data" # notebook, console
  source("../../../R/clean_labels.R") # notebook, console
Data from The enteric nervous system promotes intestinal health by constraining microbiota composition
Import
read_enteric <- function(sheet_i, range_i, file_path, wide_2_long=TRUE){
  dt_wide <- data.table(read_excel(file_path, sheet=sheet_i, range=range_i))
  dt_long <- na.omit(melt(dt_wide, measure.vars=colnames(dt_wide), variable.name="treatment", value.name="count"))
  return(dt_long)
}

folder <- "Data from The enteric nervous system promotes intestinal health by constraining microbiota composition"
fn <- "journal.pbio.2000689.s008.xlsx"
file_path <- paste(data_path, folder, fn, sep="/")
fig1c <- read_enteric(sheet_i="Figure 1", range_i="a2:b11", file_path)
fig1e <- read_enteric(sheet_i="Figure 1", range_i="d2:g31", file_path)
fig1f <- read_enteric(sheet_i="Figure 1", range_i="i2:l53", file_path)
fig2a <- read_enteric(sheet_i="Figure 2", range_i="a2:d33", file_path)
fig2d <- read_enteric(sheet_i="Figure 2", range_i="F2:I24", file_path)
fig3a <- read_enteric(sheet_i="Figure 3", range_i="a2:c24", file_path)
fig3b <- read_enteric(sheet_i="Figure 3", range_i="e2:g12", file_path)
fig4a <- read_enteric(sheet_i="Figure 4", range_i="a2:b125", file_path)
fig5c <- read_enteric(sheet_i="Figure 5", range_i="i2:l205", file_path)
fig6d <- read_enteric(sheet_i="Figure 6", range_i="I2:L16", file_path)
Estimates of the shape parameter
plot_enteric <- function(fig_i, fig_num=NULL){
  fit <- glm.nb(count ~ treatment, data=fig_i)

  #fig_num <- names(fig_i)
  if(is.null(fig_num)){
    fig_num <- deparse(substitute(fig_i)) # this works when df is sent but not a list element
  }
  theta <- fit$theta
  fit_title <- paste0(fig_num, " (theta = ", round(theta,1), ")")
  gg <- ggdotplot(fig_i,
           x="treatment",
           y="count",
           color="treatment",
           pallete="jco",
           add="mean") +
    #annotate("text", x=1, y= max(fig_i[, count]), label=paste("theta =", round(theta,1))) +
    ggtitle(fit_title) +
    rremove("legend") +
    NULL
  return(gg)
}

plot_enteric2 <- function(fig_i, fig_num, i){
  fit <- glm.nb(count ~ treatment, data=fig_i[[i]])
  #fig_no <- deparse(substitute(fig_i)) # this works when df is sent but not a list element
  #fig_no <- names(fig_i)
  theta <- fit$theta
  fit_title <- paste0(fig_num[[i]], " (theta = ", round(theta,1), ")")
  gg <- ggdotplot(fig_i[[i]],
           x="treatment",
           y="count",
           color="treatment",
           pallete="jco",
           add="mean") +
    #annotate("text", x=1, y= max(fig_i[, count]), label=paste("theta =", round(theta,1))) +
    ggtitle(fit_title) +
    rremove("legend") +
    NULL
  return(gg)
}

fig_list_names <- c("fig1c", "fig1e", "fig1f", "fig2a", "fig2d", "fig3a", "fig3b", "fig4a", "fig5c", "fig6d")
fig_list <- list(fig1c, fig1e, fig1f, fig2a, fig2d, fig3a, fig3b, fig4a, fig5c, fig6d)
names(fig_list) <- fig_list_names # super kludgy
# this doesn't work
# gg_list <- lapply(fig_list, plot_enteric, names(fig_list))

# this works but requires i in the function which is unsatifying
#gg_list <- lapply(seq_along(fig_list), plot_enteric2, fig_i=fig_list, fig_num=names(fig_list))
gg_list <- list(NULL)
for(i in 1:length(fig_list)){
  gg_list[[i]] <- plot_enteric(fig_list[[i]], names(fig_list)[[i]])
}

plot_grid(plotlist=gg_list, ncol = 3)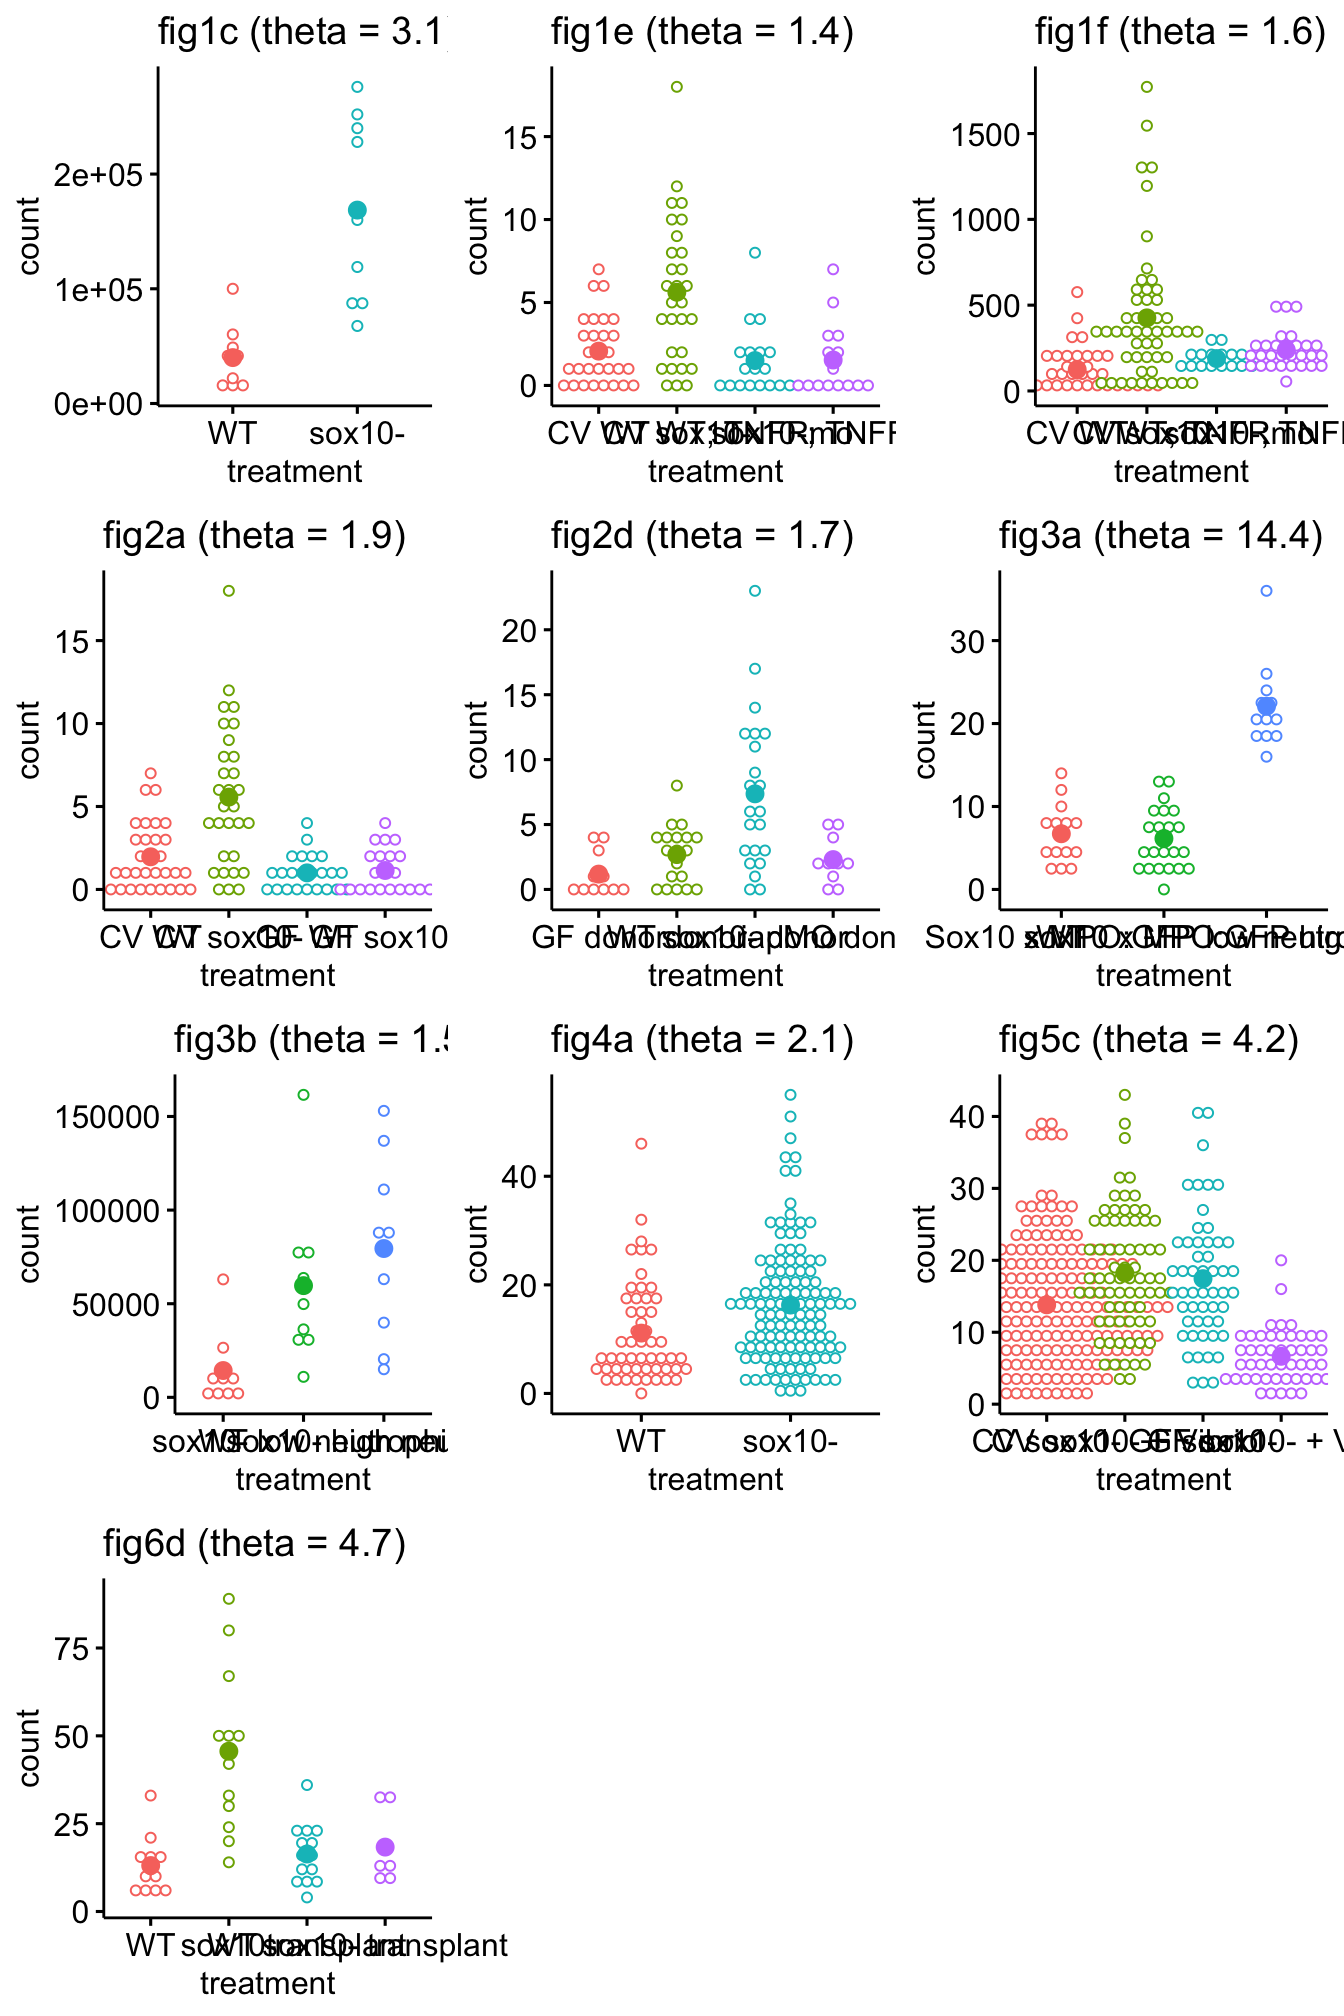
Data from Organic cation transporter 3 (Oct3) is a distinct catecholamines clearance route in adipocytes mediating the beiging of white adipose tissue
Import
folder <- "Data from Organic cation transporter 3 (Oct3) is a distinct catecholamines clearance route in adipocytes mediating the beiging of white adipose tissue"
fn <- "journal.pbio.2006571.s012.xlsx"
file_path <- paste(data_path, folder, fn, sep="/")
fig5b <- read_enteric(sheet_i="Fig 5B", range_i="b2:c12", file_path)
plot_enteric(fig5b)