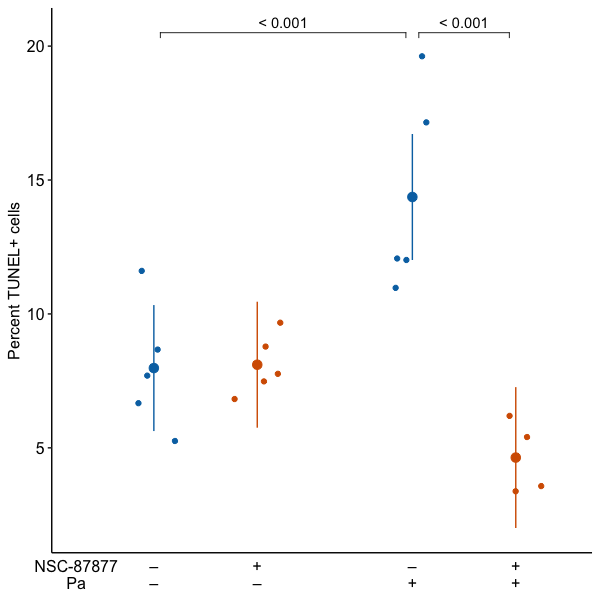
How to make plots with factor levels below the x-axis (bench-biology style)
The motivation for this post was to create a pipeline for generating publication-ready plots entirely within ggplot and avoid post-generation touch-ups in Illustrator or Inkscape. These scripts are a start. The ideal modification would be turning the chunks into functions with personalized detail so that a research team could quickly and efficiently generate multiple plots. I might try to turn the scripts into a very-general-but-not-ready-for-r-package function for my students.


